
Note: Homa Team and our external studios can view all the results of their game, you will be able to see if the A/B result has encouraging results and/or if you want to create new tests. If not, you can deploy the new value in the game for new players.
Once the test is launched, new players will start to be randomly allocated to test groups, based on the % and criteria you selected. Each day statistical tests will be run to calculate the differences between the groups. Depending on the volume of installs and the scale of differences between groups, getting statistically significant results may happen as soon as the next day, or take a few days.
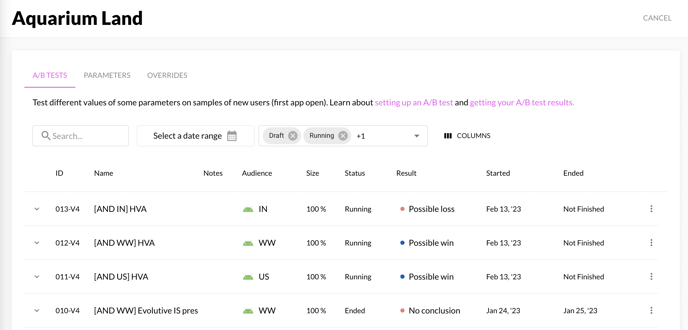
How are results displayed on N-testing?
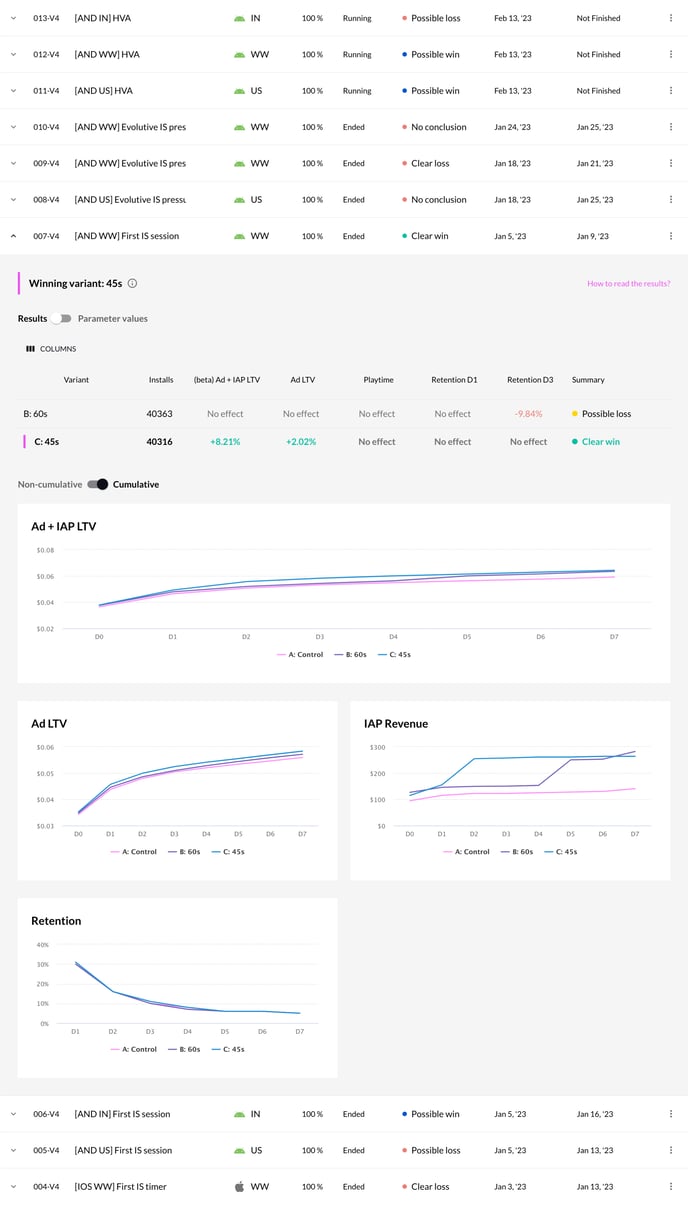
For a given A/B testing, you will be able to find a table and a graph with all the results from all your test configurations. By default, we display the column with the best result.
You have a graph to compare data into the differents variants
| Value | Description | Guideline |
| Summary | For each configuration, you will have a status result that can have 5 possibles values: |
- No result: no change has been logged during the A/B testing - Clear loss: Ad LTV has a bad value and decrease compared to the control - Stopped: all the data has decreased, this configuration should not be applied to the game - Possible win: Ad LTV has a good value and increase compared to the control - Clear win: Ad LTV has a excellent value and increase compared to the control |
| Result / Variant | List of all the configuration that are available in your A/B Test |
- If you want to roll out this configuration in your game, you can click on the button “roll out [name]”. A pop-up will display and you can choose the scope to roll out the parameters. - The variant with the best result will be automatically selected. |
| Installs | Number of installations (new players) which are playing with this configuration | New players will be placed randomly into one of these configurations. |
| Retention | Value in percentage of the players who come back to play the game X days after (D3) the installation (D0) compared to the current configuration which are in the “production”. | |
| Playtime |
Value in percentage of the average playtime between the production configuration and the test configuration, it will update every day during the duration of the test. To calculate this value we take the total of play time of the “production” configuration and the test configuration and we calculate the difference in percentage to display it in the table. |
|
| Ad LTV |
Value in percentage of the Ad LTV revenue X days after the installation of the game between the “production” configuration and the test configuration. To calculate this value we take the total Ad LTV of the “production” configuration and the test configuration and we calculate the difference in percentage to display it in the table. |
Ps: When you stop your experiment, data will still update until the D30, but we will not add new user into the experiment
Next step: How to apply new parameters value from finished A/B test